SES Engineering Services
SES Engineering Services connected planned deliverables with documents arriving in Dalux, then brought setup requests, licences, training and feedback into a governance hub so its digital team could identify rollout and support needs.
SES Engineering Services · 2 December 2025
James Bishop CMgr, then Digital Technology Manager. Amrik Aujla, then Assistant Digital Technologist. Howa ‘Eve’ Bader, National Digital Standards Lead. Javier Lopez, National Digital Development Lead.
SES Engineering Services’ community presentation was published on 2 December 2025.
SES connected planned deliverables to documents arriving in Dalux. As project teams expanded their use of Morta, they developed different ways of working. The digital team needed shared standards and a way to manage the support required across projects.
Executive summary
SES Engineering Services, part of Wates Group, used Morta to compare planned information deliveries with documents in Dalux. Its digital team then brought setup requests, licences, training and feedback into a central Wates Group governance hub. Shared standards and a route for template changes helped it coordinate development across projects. Synced project and member data fed dashboards that the team used to examine uptake, investigate connection problems and identify support needs. Javier’s information delivery planning figures included more than 60,000 documents monitored daily. Eve’s request and training processes, Amrik’s approach to standards and onboarding, and James’s linked-data work supported the rollout. A mandatory information delivery planning rollout was approaching, while an employee portal and a wider programme across business functions remained in development.
Information delivery planning at the time
Javier gave these figures for the information delivery planning work in the presentation published on 2 December 2025.
- 10 projects used task and master information delivery planning templates.
- More than 50 active users entered data into task plans or managed master plans.
- More than 60,000 documents were monitored daily through the information delivery planning process.
The results
Project teams could compare expected information deliveries with what had arrived. Task information delivery plans (TIDPs) and master information delivery plans (MIDPs) held planned deliverables in Morta. A connection to Dalux, SES’s common data environment, brought in the actual document data. The comparison made variance in design delivery visible to the teams managing those plans.
The governance hub gave the digital team a different view of the work. It combined requests, processing times, activity, licences, training and feedback. The team could see where rollout activity was concentrated, investigate slow hub creation and find people who needed help.
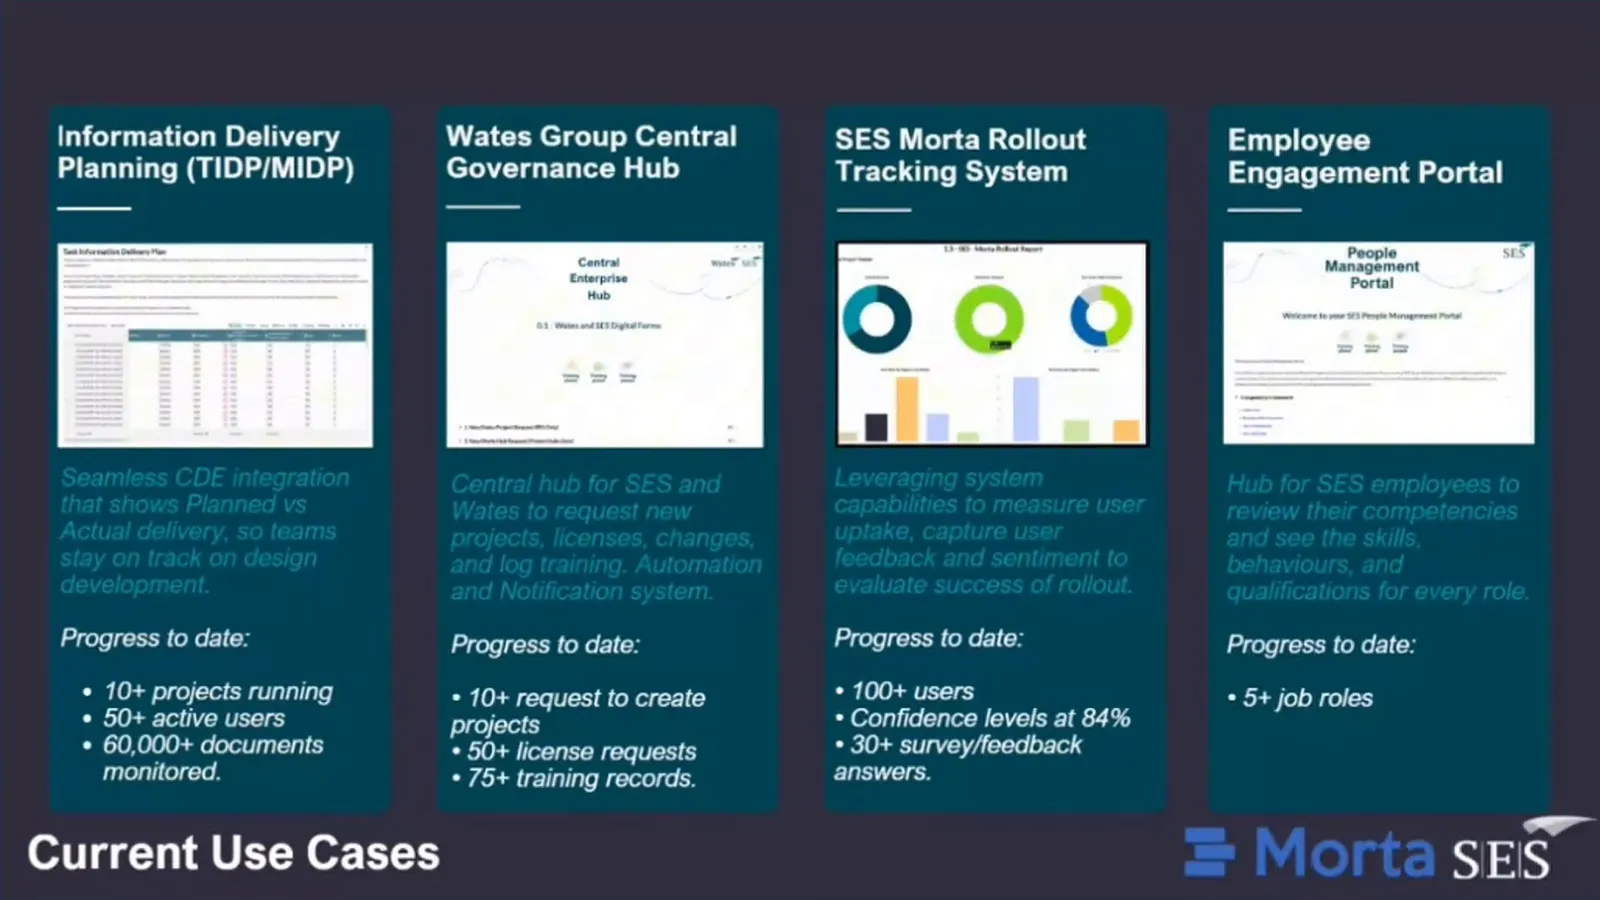
SES also had a focused rollout report for its own projects and people within the wider Wates Group hub. The employee engagement portal had a separate purpose. Still in development, it was intended to show SES employees the skills, behaviours and qualifications required for their roles.
The challenge
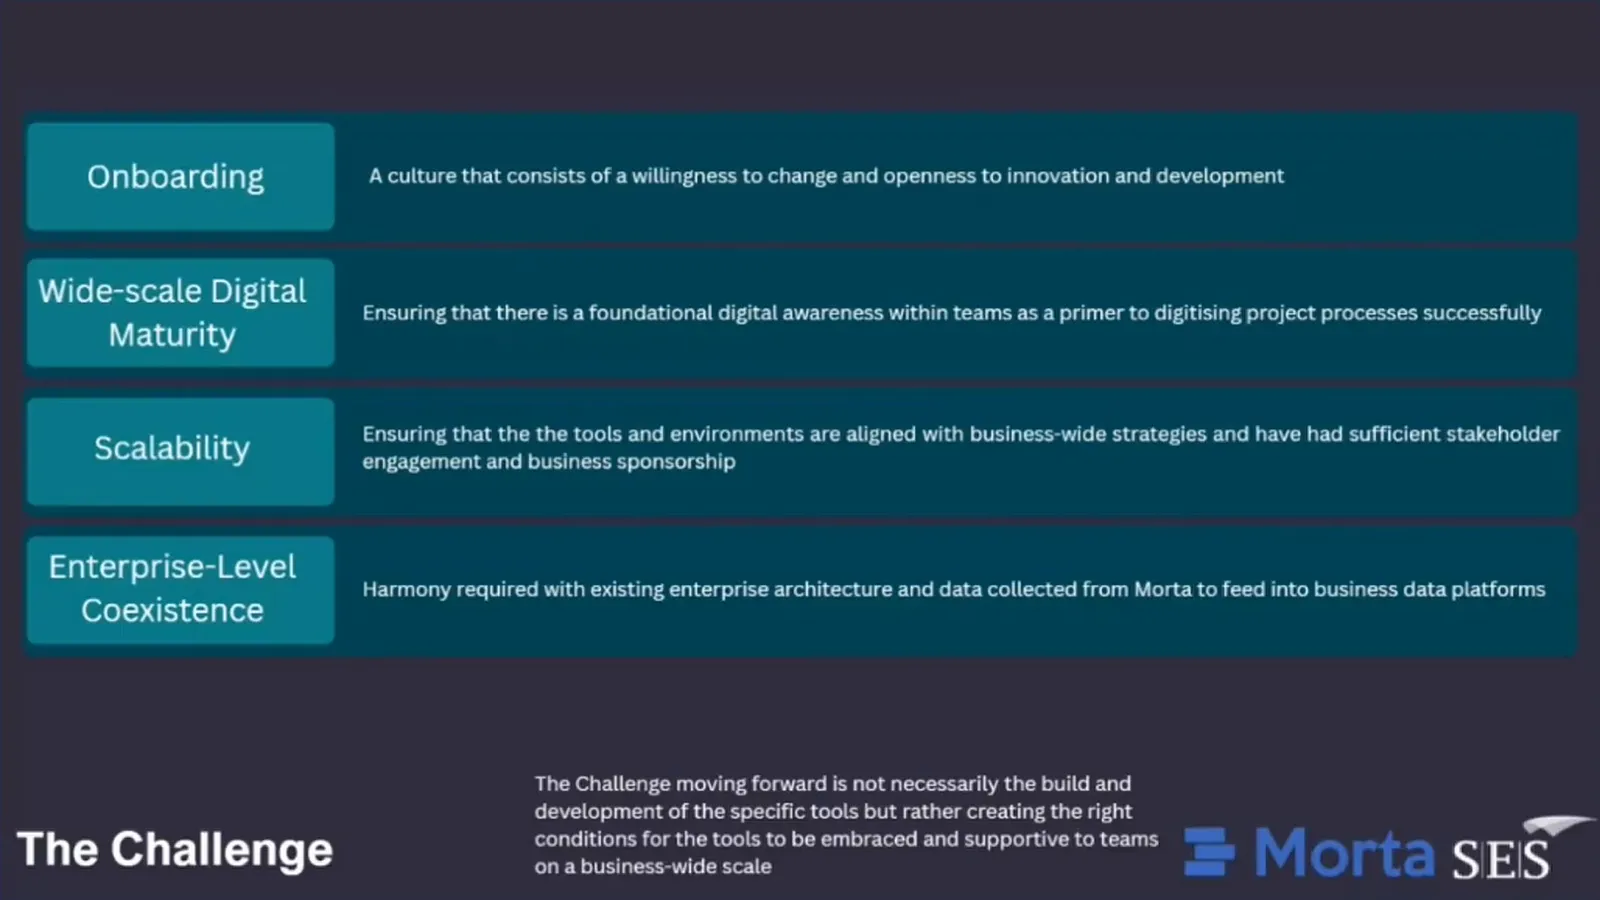
Amrik’s starting point was the variation developing across projects. Teams had moved beyond their original information delivery plans and connected more of their processes in Morta. That increased connections within individual projects, but different approaches persisted across the portfolio.
Development and standards need to work together. Experimentation produces new approaches, while shared conventions make them consistent enough to reuse. Amrik identified the risk on both sides. Development without standards limited consistency and scale. Standards without continued development could make the approach too rigid to improve.
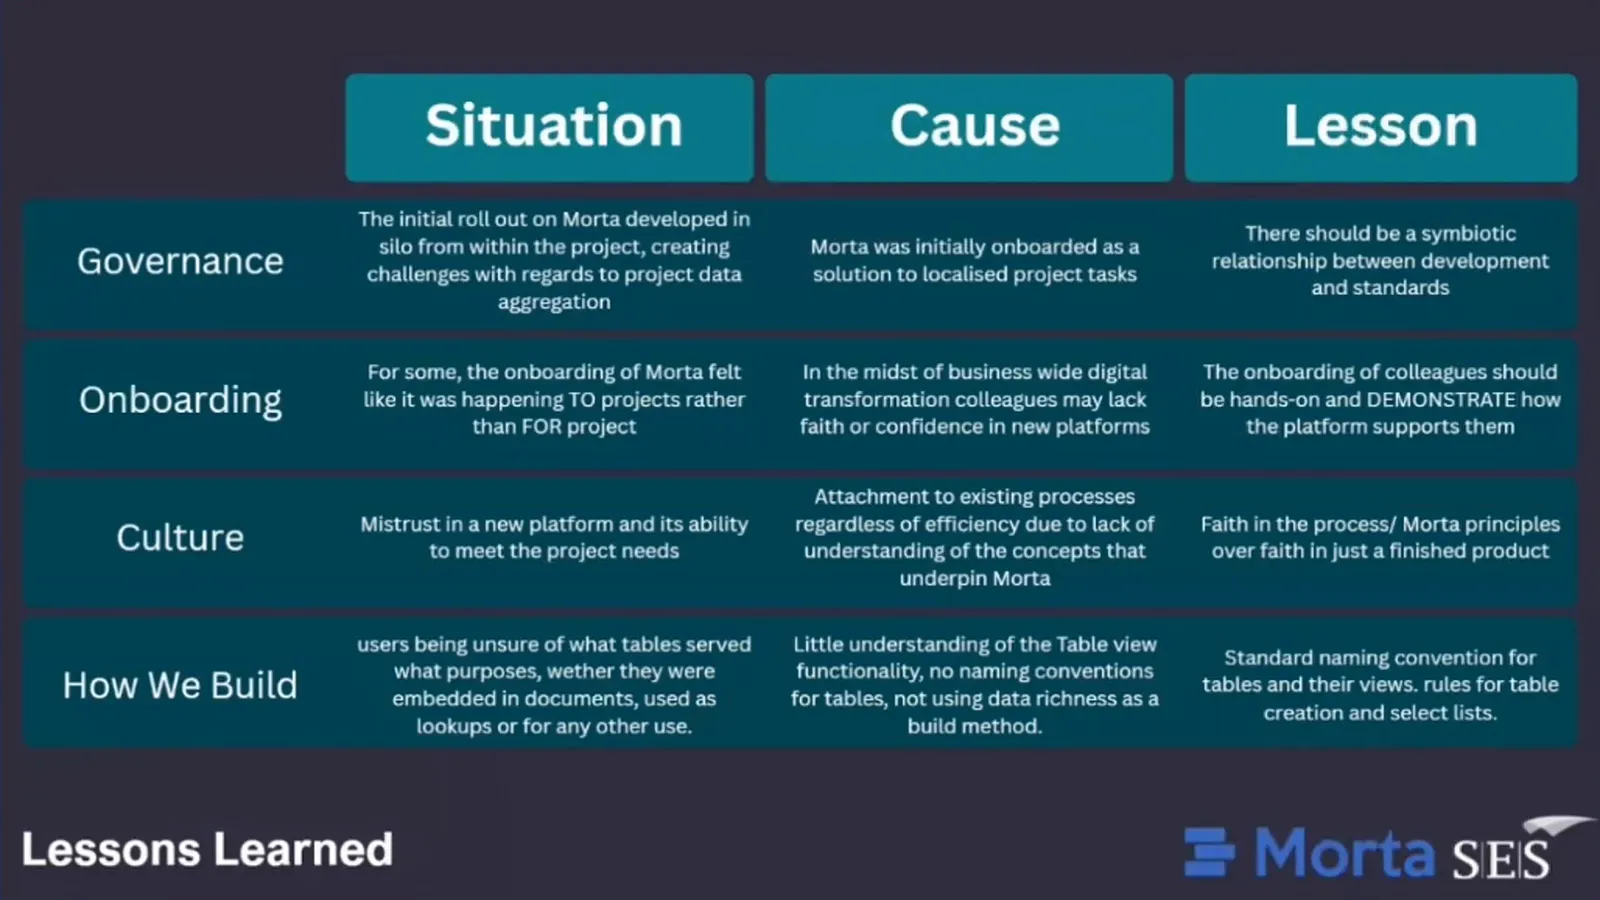
Project teams also had to fit a new platform around busy delivery schedules. Amrik wanted onboarding to provide practical support and make its use clear in the work people already did. Understanding structured data, rule-based automation and reporting would give teams principles they could apply to their own disciplines.
The solution
Requests that reached the digital team
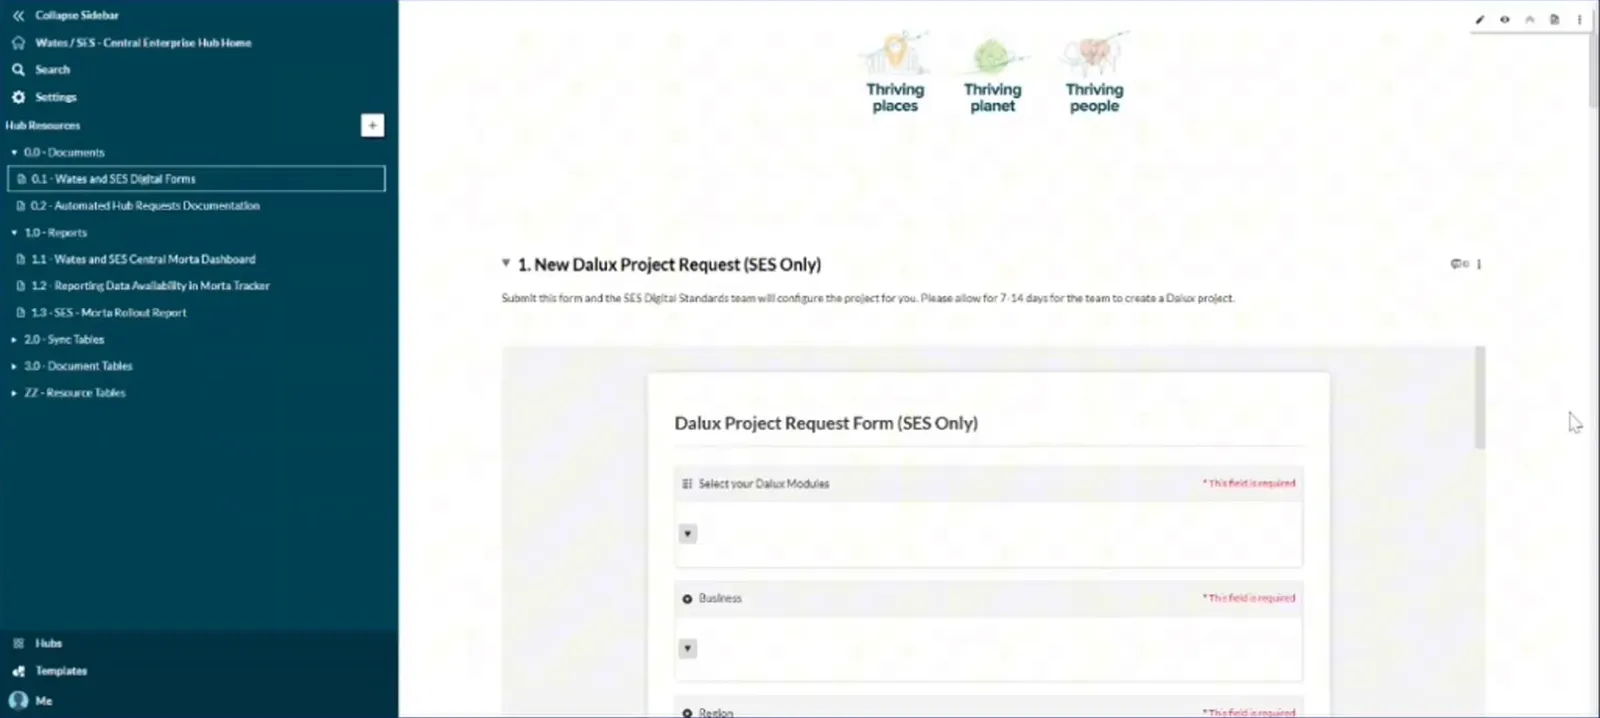
Eve’s team linked the central hub’s forms from its SharePoint page. Project staff could request setup, training and builder or owner licences through that route. A Dalux project request notified the department by email, giving the digital team the request it needed to deploy and configure the systems.
SES worked with different main contractors, so the process included Morta hub requests for projects using Dalux and for those using another common data environment. Javier put automated Morta hub creation at minutes after a business user submitted a form. The separate Dalux setup request asked teams to allow 7–14 days. Projects therefore had different lead times for the two setup steps.
Feedback and changes to shared templates
Feedback forms asked projects what was working, what was causing problems and where they needed help. The responses fed a table with high, medium and low impact categories. Eve’s team used that impact to prioritise its response. Javier linked the feedback to investigating bugs and making changes to templates or the system.
A separate enhancement request notified Digital Development when a deployed template needed a change. Projects could explain what did and did not work for them, while the development team handled changes to the shared templates. This gave project experience a route into the standards used across the rollout.
Finding gaps in deployment and data flow
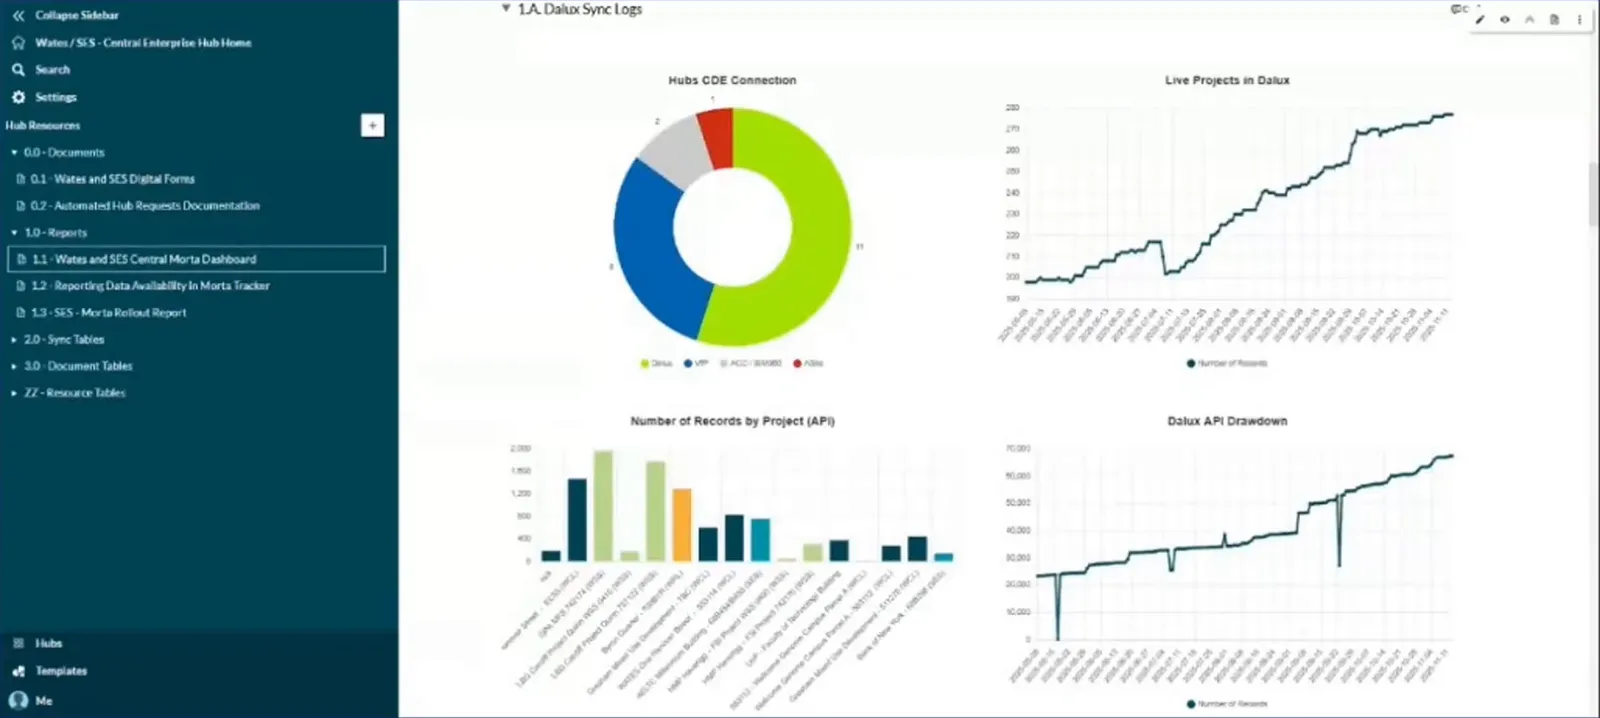
The group dashboard broke hub requests and activity down by business unit and region. Javier used those views to understand where Morta’s rollout was more active and where gaps remained. The dashboard also tracked hub creation time, allowing the digital team to notice when an automation took longer than expected.
Dalux sync logs helped the team investigate the flow of data into project reporting. Javier identified a drop in a graph associated with an API problem. The digital team could use that change to locate a connection fault affecting the data on which comparisons between planned and actual delivery depended.
Linked tables behind the dashboard
James’s team built the dashboard largely from synced project and member data, enriched with the form responses. Six linked tables supplied the dashboard, and reporting drew automatically on those connections. This changed the team’s approach to building in Morta towards maintaining data in databases and presenting it through documents.
The native charts also became training material. James used the dashboard to teach chart functionality and explore its limits. That work deepened the team’s understanding of the platform and changed how it built subsequent tools.
Confidence and training alongside deployment
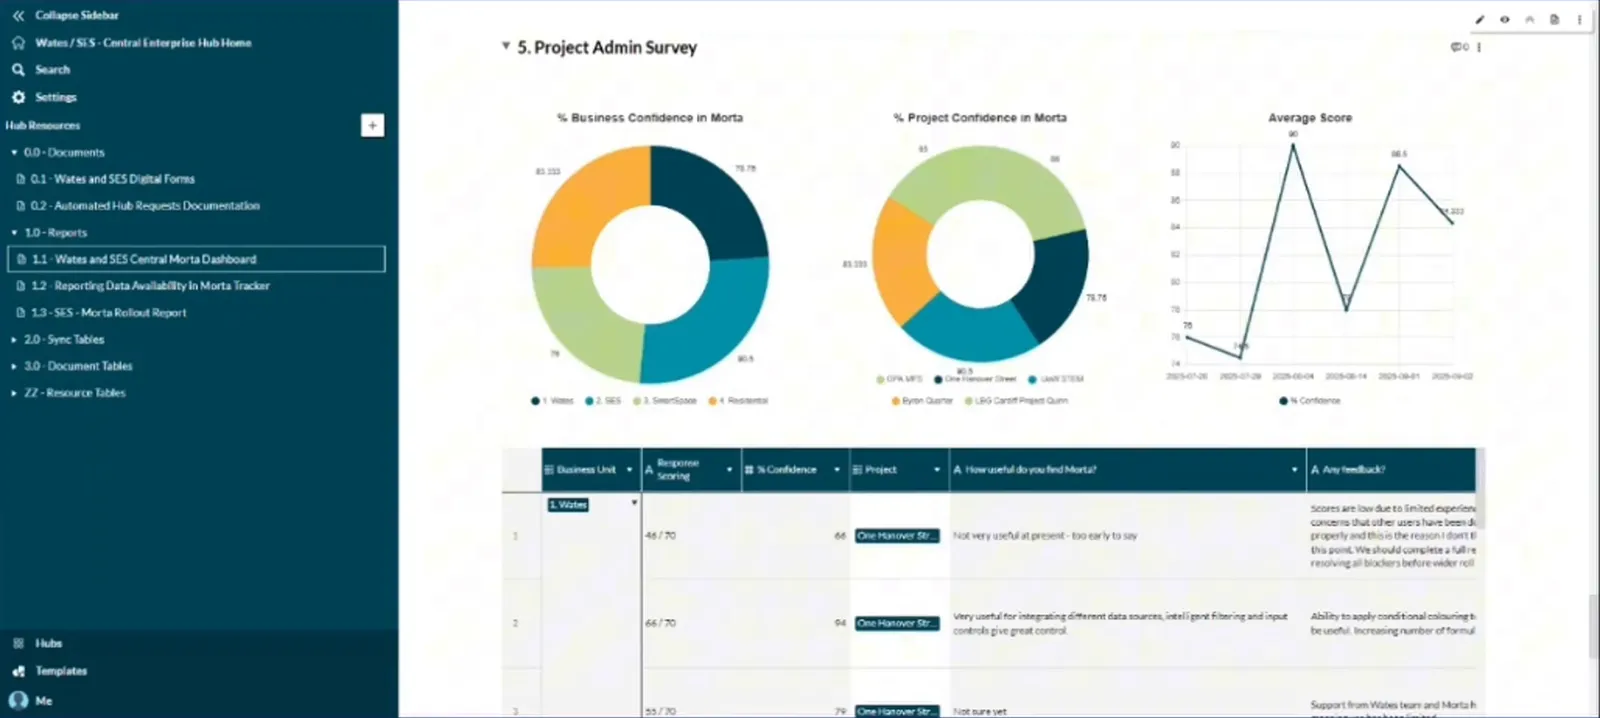
A live hub does not tell the digital team whether its project administrators can use it confidently. SES’s administrator survey asked what was working and whether more support or training was needed. The scores and written responses gave the team a way to identify those needs alongside the number of projects using Morta.
Training records added attendance and session duration to the picture. Javier’s team compared the training information with its separate learning system, which held videos and presentations. The comparison helped it identify gaps in training across the business.
Builder and owner licences were requested as people developed their ability to work in Morta. Tracking licence activity gave the team a view of how that access was distributed across business units.
A focused view for SES
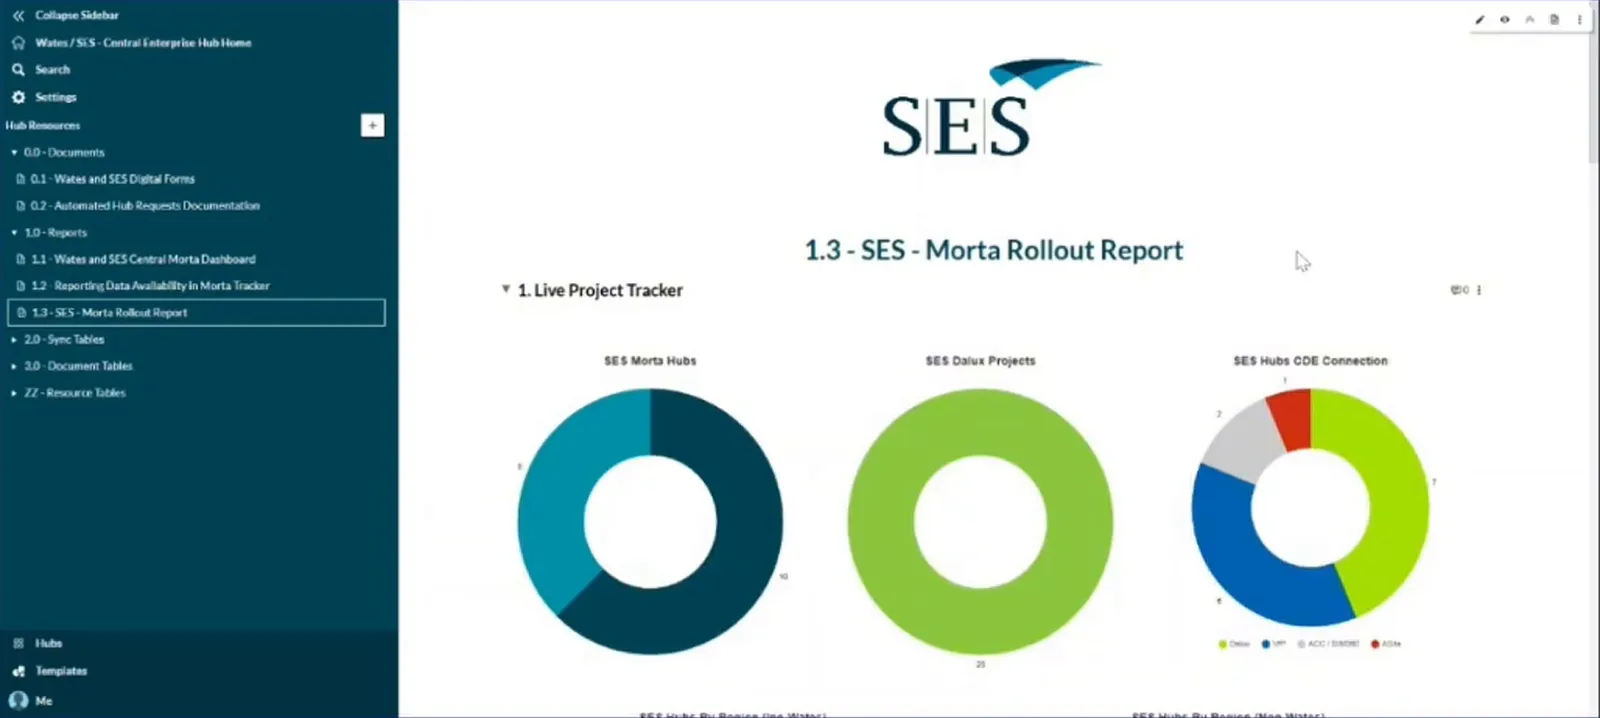
Eve used SES’s own rollout report to govern its projects and direct training where it was needed. It separated work with Wates from work with other main contractors, then broke down regions, user types, licences and CDE connections. The digital team could inspect SES’s needs within the larger group rollout, including projects that used a different CDE.
Reporting from the data available
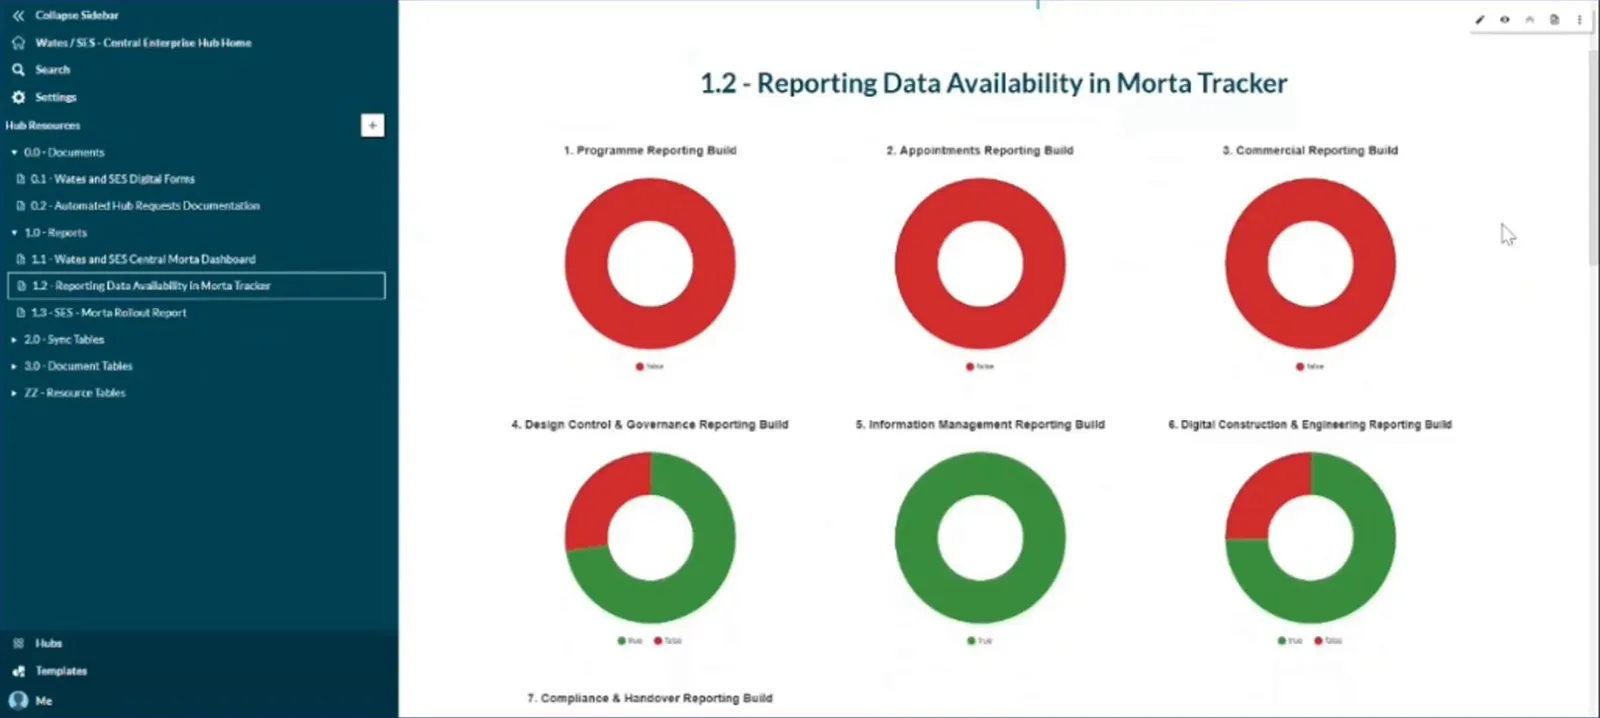
Javier’s reporting data availability register linked reporting requirements to the information already held in Morta or Dalux. Green indicators marked available data. Red indicators identified gaps that could need additional synchronisation or integration.
The digital team used that register in discussions with stakeholders. It could identify which reports were possible immediately and which needed further data connections. A reporting request could then lead to an available output or a defined piece of integration work.
The implementation
Development and standards in the team
SES first encountered Morta through Ministry of Justice schemes alongside Wates. The work developed into a broader design-management business plan, engagement across SES, a digital transformation department and a group enterprise contract. James placed the programme within SES’s business strategy, with backing from the board.
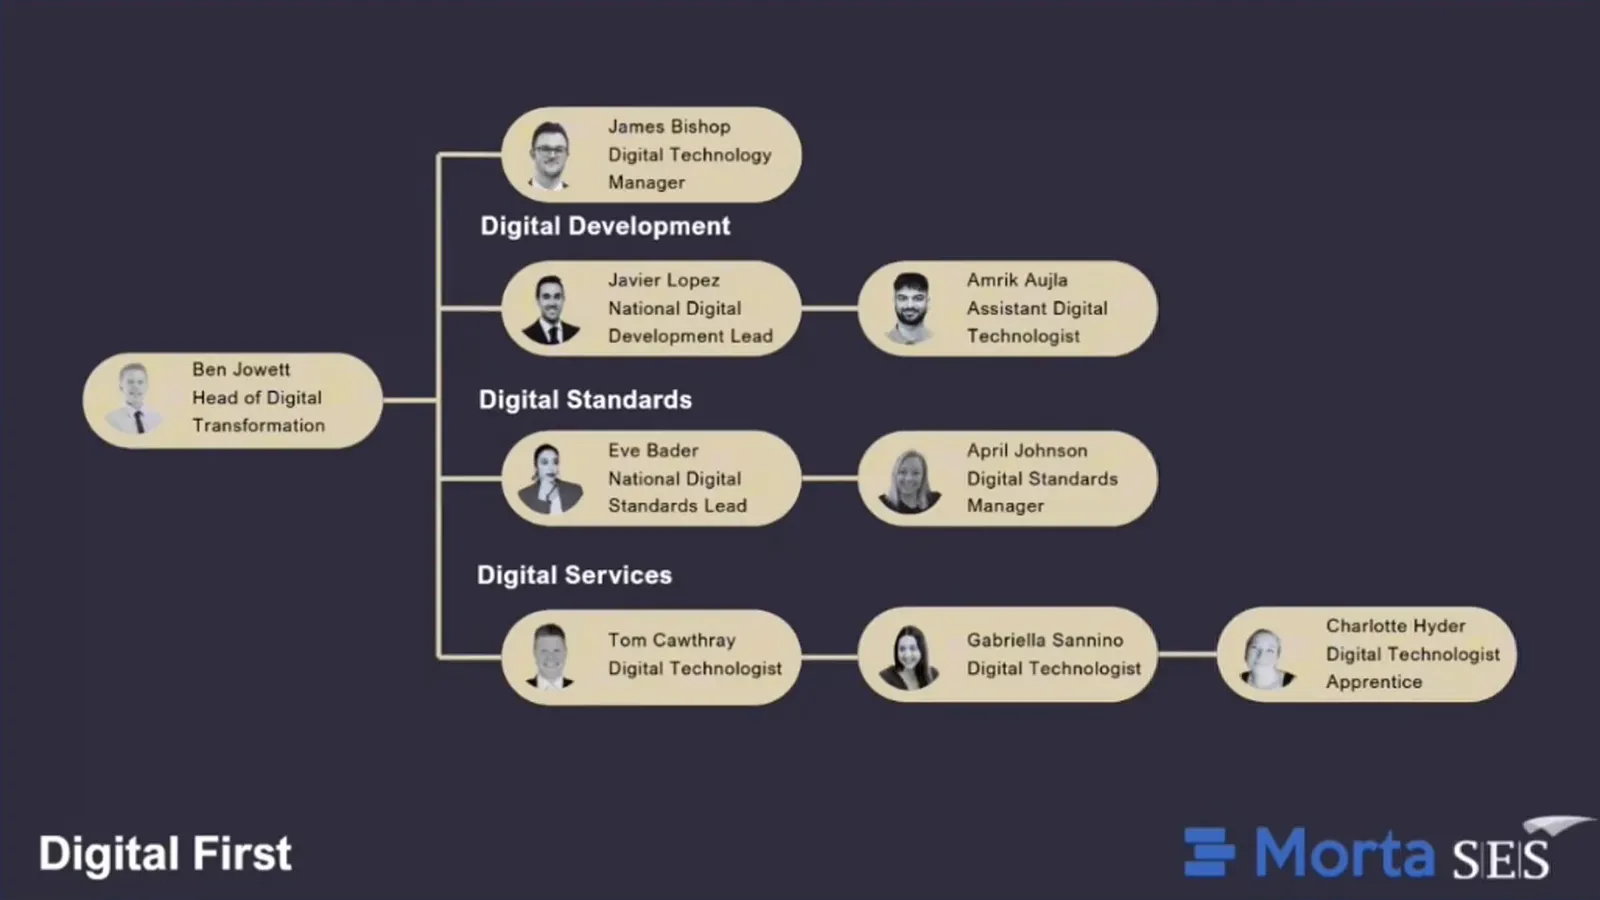
Javier led Digital Development, with Amrik working alongside him as Assistant Digital Technologist. Eve led Digital Standards, supported by April Johnson, Digital Standards Manager. James worked on technology platforms and how the business used them. He put the team building and supporting Morta at five people, within a wider department that also included leadership and Digital Services.
Preparing people to use the systems
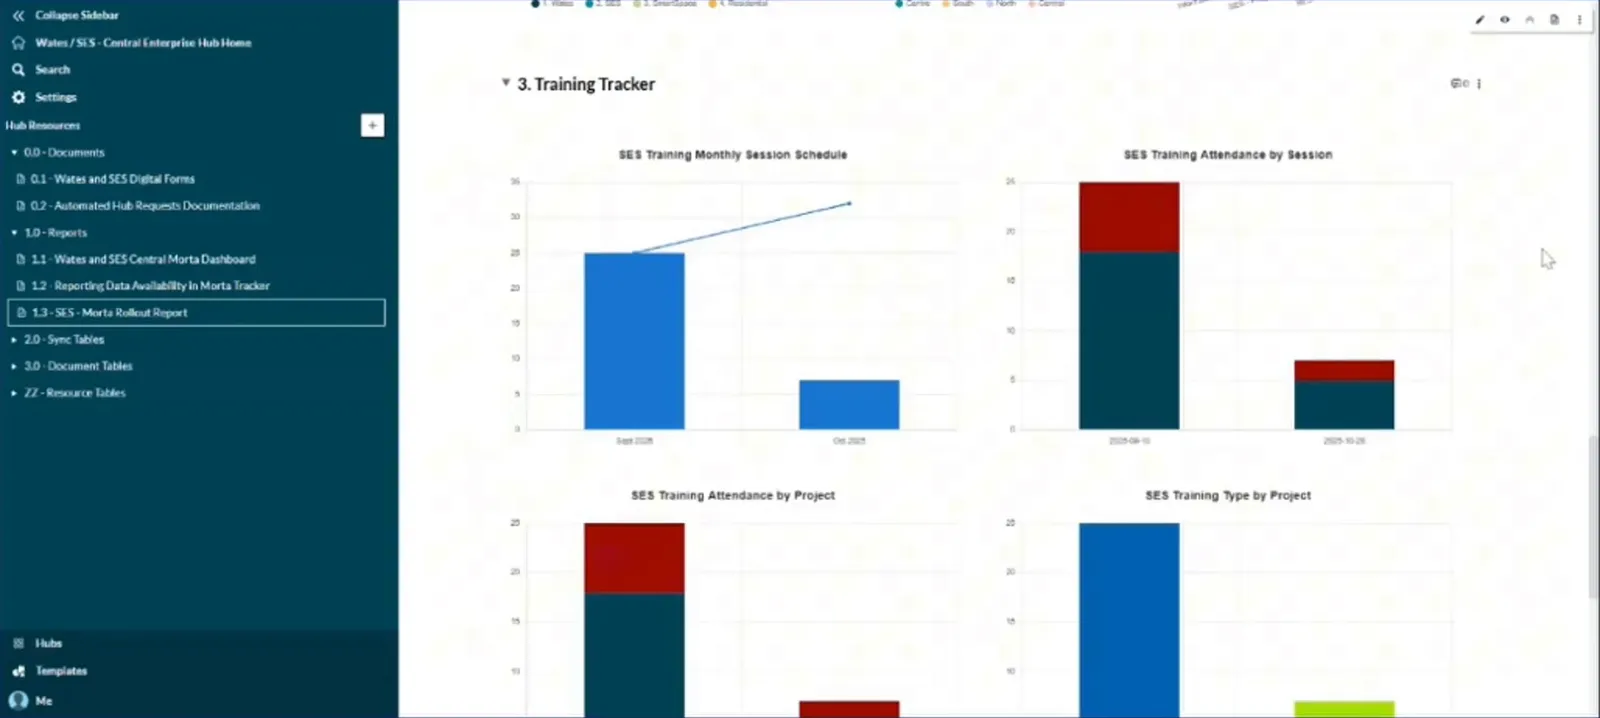
Eve used training requests to establish who would attend and what training they required before a session. The attendance tracker recorded who had taken part and distinguished Morta from Dalux training. Her team configured systems first, then invited members once they had been trained.
A guide on the SharePoint page recorded how to set up and duplicate hubs. Alongside that practical guidance, Amrik emphasised learning how documents, tables and views worked before applying naming conventions. The aim was to give project teams a consistent way to build and use the platform.
Eve wanted that support to develop into a wider information management community within SES. Training, shared processes and stronger skills were part of helping colleagues use the systems in their daily work.
Shaping the TIDP tool around its users
For the TIDP tool, James put the engagement at just over 440 people across the relevant business functions. SES involved those people while developing the tool to fit end-user needs and the business’s requirements. The count concerned shaping that particular tool.
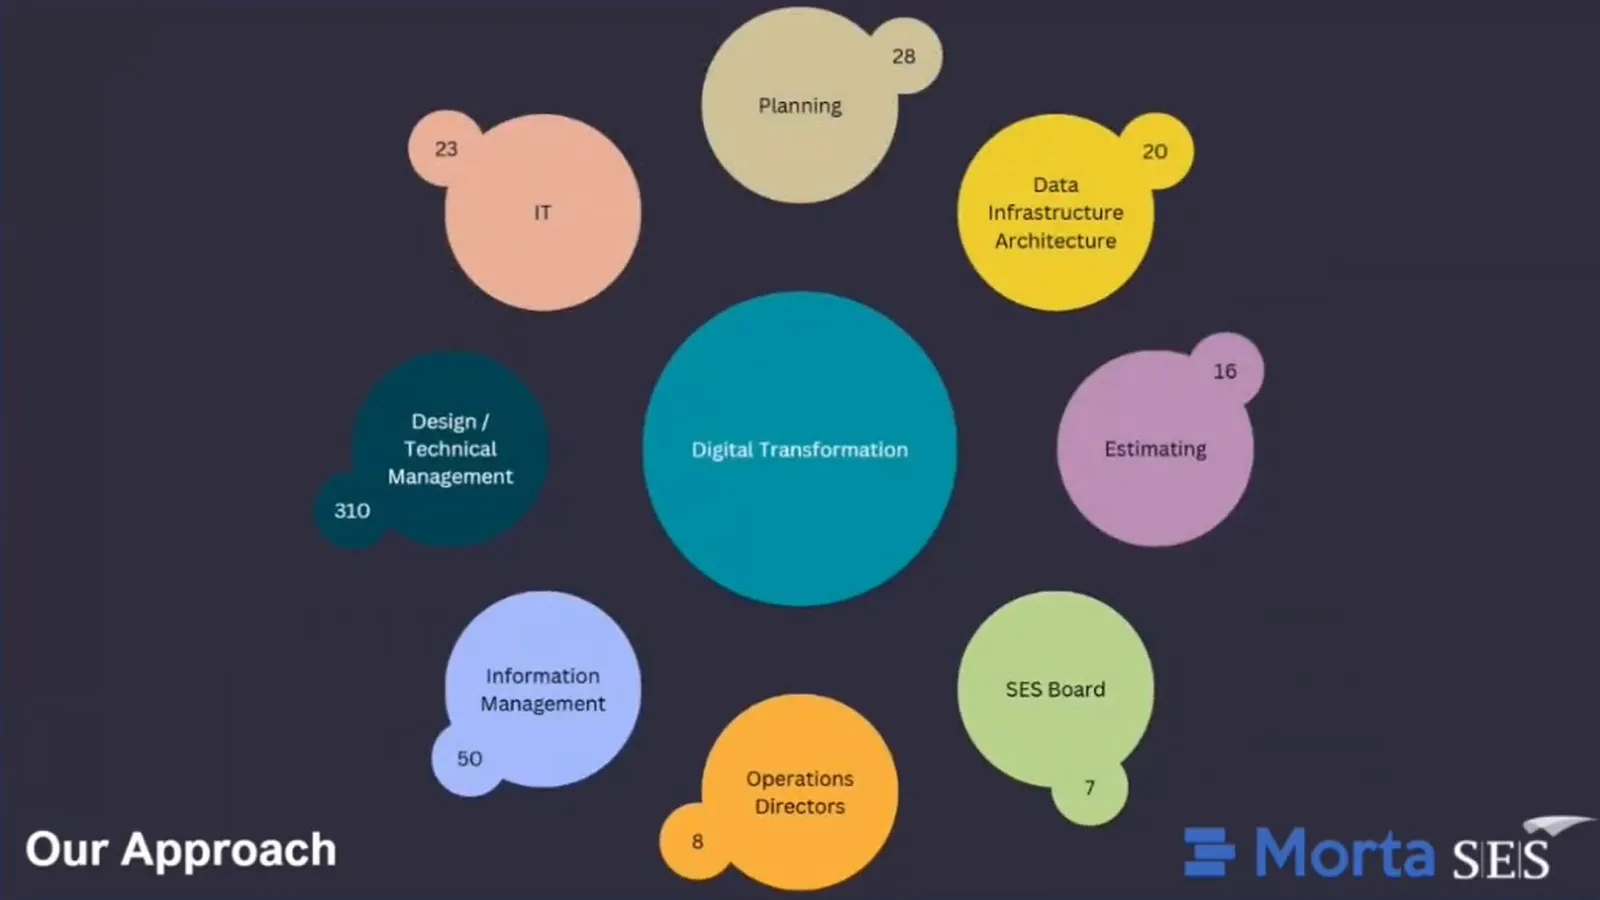
Javier planned to involve the relevant functions in the next programme of work as well. That meant developing processes with the teams whose work would change, while building their skills alongside the tools.
Before and after
| Criterion | Earlier approach | Approach developed by SES |
|---|---|---|
| Consistency across projects | Projects developed their Morta use in different ways. | Development worked alongside standards and naming conventions. |
| Improving templates | Local development added connections within individual projects. | Projects could submit enhancement requests to Digital Development for shared templates. |
| Understanding deployment | Initial work centred on information delivery planning. | The governance hub brought rollout, activity, training, licence and confidence data together. |
| Preparing teams | A new platform could feel like another administrative task. | Practical onboarding connected data principles, platform basics and training to project work. |
About SES Engineering Services
SES Engineering Services is a Wates Group building-services business. It designs, manufactures and installs building services and infrastructure for Tier One contractors and end users.
What's next
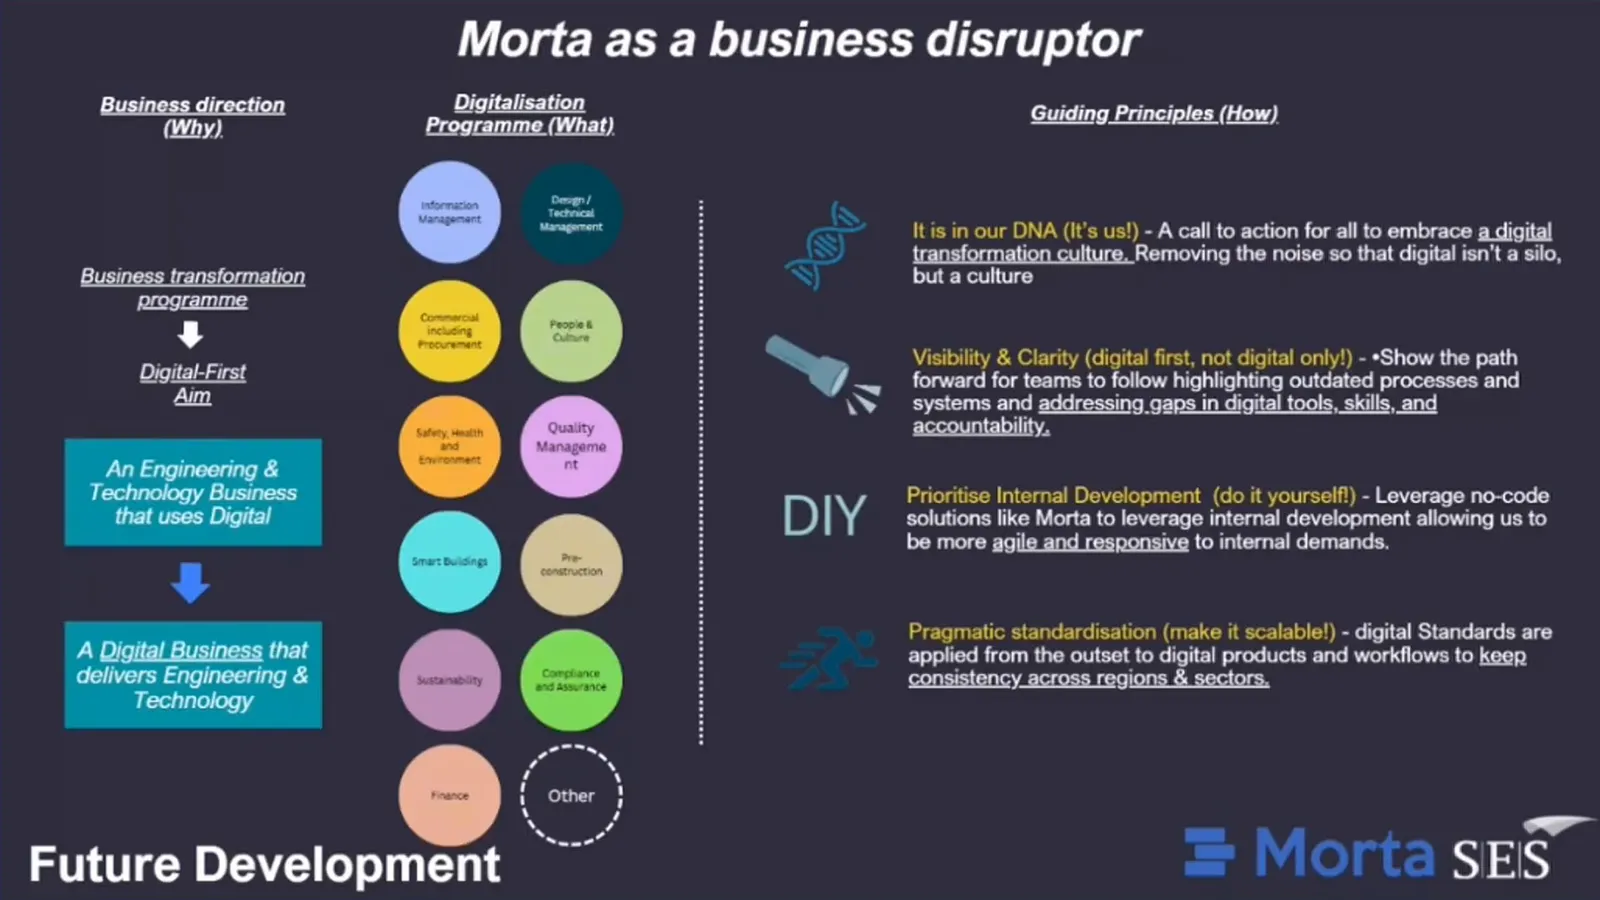
A mandatory information delivery planning rollout across SES projects was approaching at the time of the presentation. The employee engagement portal was still being developed. The wider programme was intended to extend from information management into design and technical management, people and culture, commercial activity, pre-construction and finance.
Further areas included safety, quality, smart buildings, sustainability and assurance. Javier intended to bring the relevant business functions into that work, with the delivery strategy still being developed.
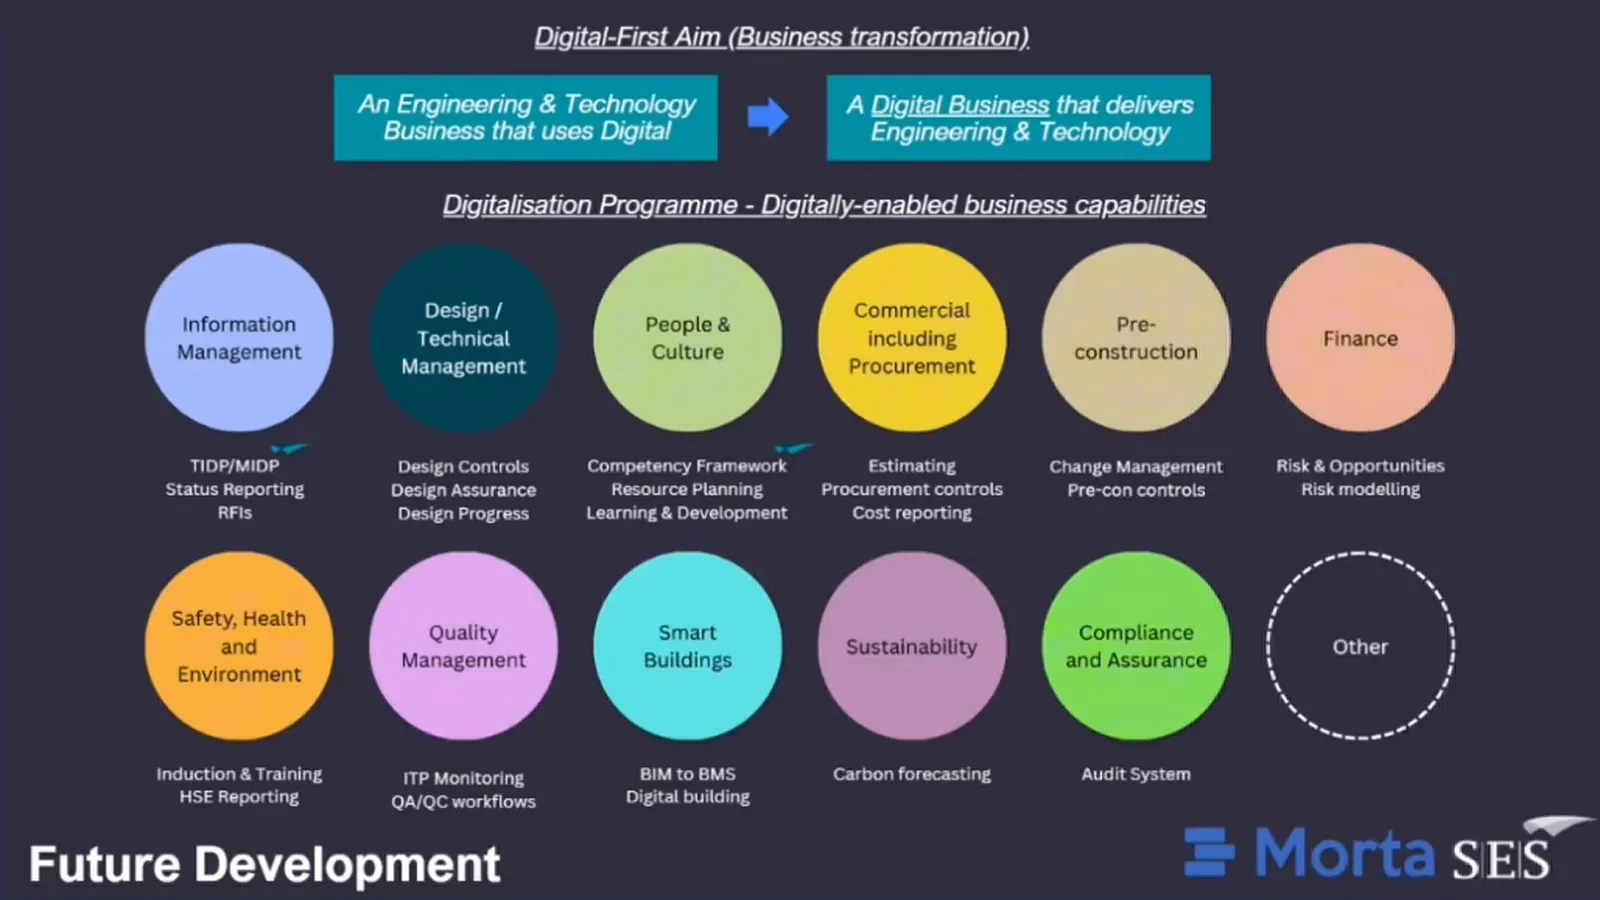
The programme’s principles connected new tools to practical business needs. Javier wanted business functions to share responsibility for the change. He wanted teams to identify outdated processes and address gaps in tools, skills and accountability. Internal development with low-code and no-code tools would let business users try small working versions and respond to changing needs. Standards applied from the outset were intended to make those tools reusable across regions and business units.
Amrik identified the conditions needed for the work to last. Teams would need digital awareness and data literacy while continuing to deliver projects. Wider deployment would also need sponsorship, alignment with business strategy and relevant standards.
Clear responsibilities across systems were another part of that work. Amrik wanted Morta and the existing enterprise systems to have understood purposes, so teams could connect their work without duplicating it. Agreement between the people responsible for those systems was part of establishing that shared approach.