Source Companion
Abdelrhman Negm, then at ALEC
How ALEC calculated package progress from connected project data
ALEC connected package identity, planned dates, onboarding and Aconex drawing data in one matrix. Restricted working tables fed shared Morta and Power BI views, while the demonstrated Aconex refresh was inactive.
ALEC's package matrix brought package identity, planned dates, onboarding and drawing delivery into one connected view. The teams maintaining those records could work in restricted tables while sharing progress through Morta views and Power BI.
Watch the original Community Showcase
Executive summary
ALEC combined a maintained package list with planner-supplied dates and weightings, recorded onboarding steps and shop-drawing metadata from Aconex. For onboarded packages, total, issued and approved drawing counts supported engineering-progress calculations. The project team and upstream participants could inspect progress and compare onboarding with planned dates through shared reporting views, while access to the working tables remained restricted. Abdelrhman Negm's showcase covered both calculated measures and manual updates. The intended daily Aconex refresh depended on the connection, which was marked inactive during the demonstration.
Project scale
- 20 or 50-plus work packages: Abdelrhman's scale examples for the packages ALEC could need to track as projects progressed.
The package matrix connected different inputs
Tracking a package involves more than recording its latest percentage. Its subcontractor details, planned dates, completed onboarding steps and drawing status each answer a different part of the progress picture. ALEC's matrix connected those inputs while retaining the tables and contributions that supplied them.
Keep package identity tied to the project-team table
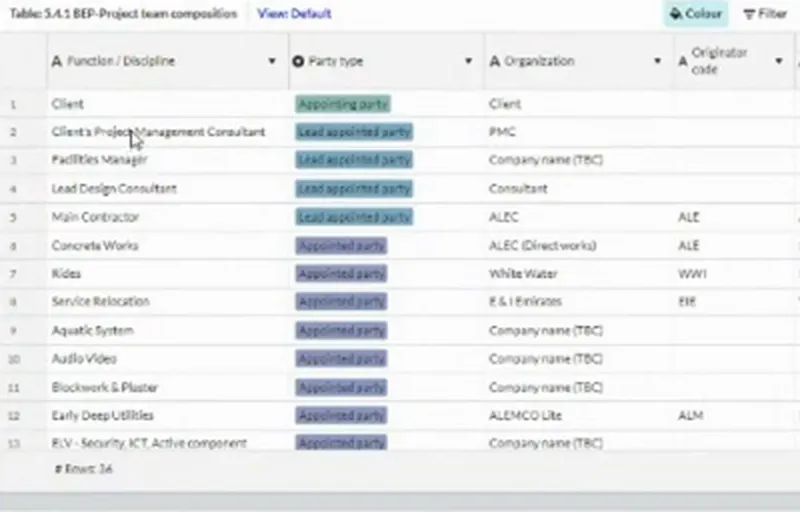
The project-team composition table held the package list and the subcontractor names and contact details added during onboarding. The matrix's package-name field selected from that list, bringing the package and its associated organisation into the tracker.
A change in commercial strategy could add another package. Abdelrhman would first update the project-team composition table, making the revised package available to the matrix. The source list determined which package identity the tracker could use.
Compare onboarding with the plan
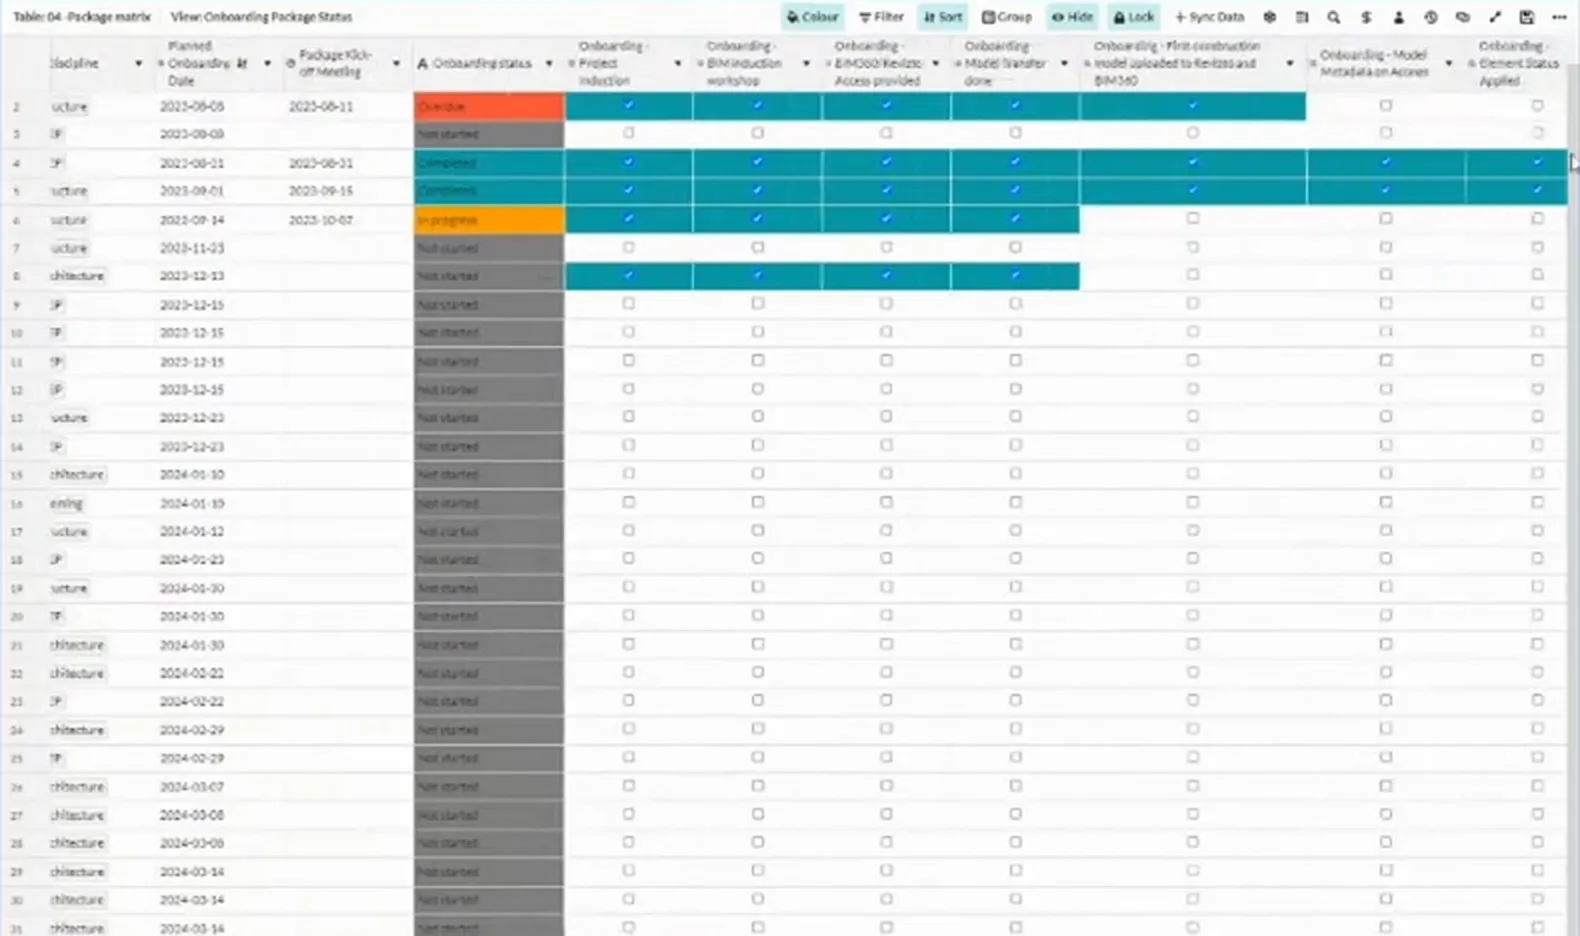
Planners supplied a weighting and dates for each package. The dates covered planned onboarding, the package kick-off meeting, engineering, construction and handover. These planning inputs sat alongside the package's onboarding tracker.
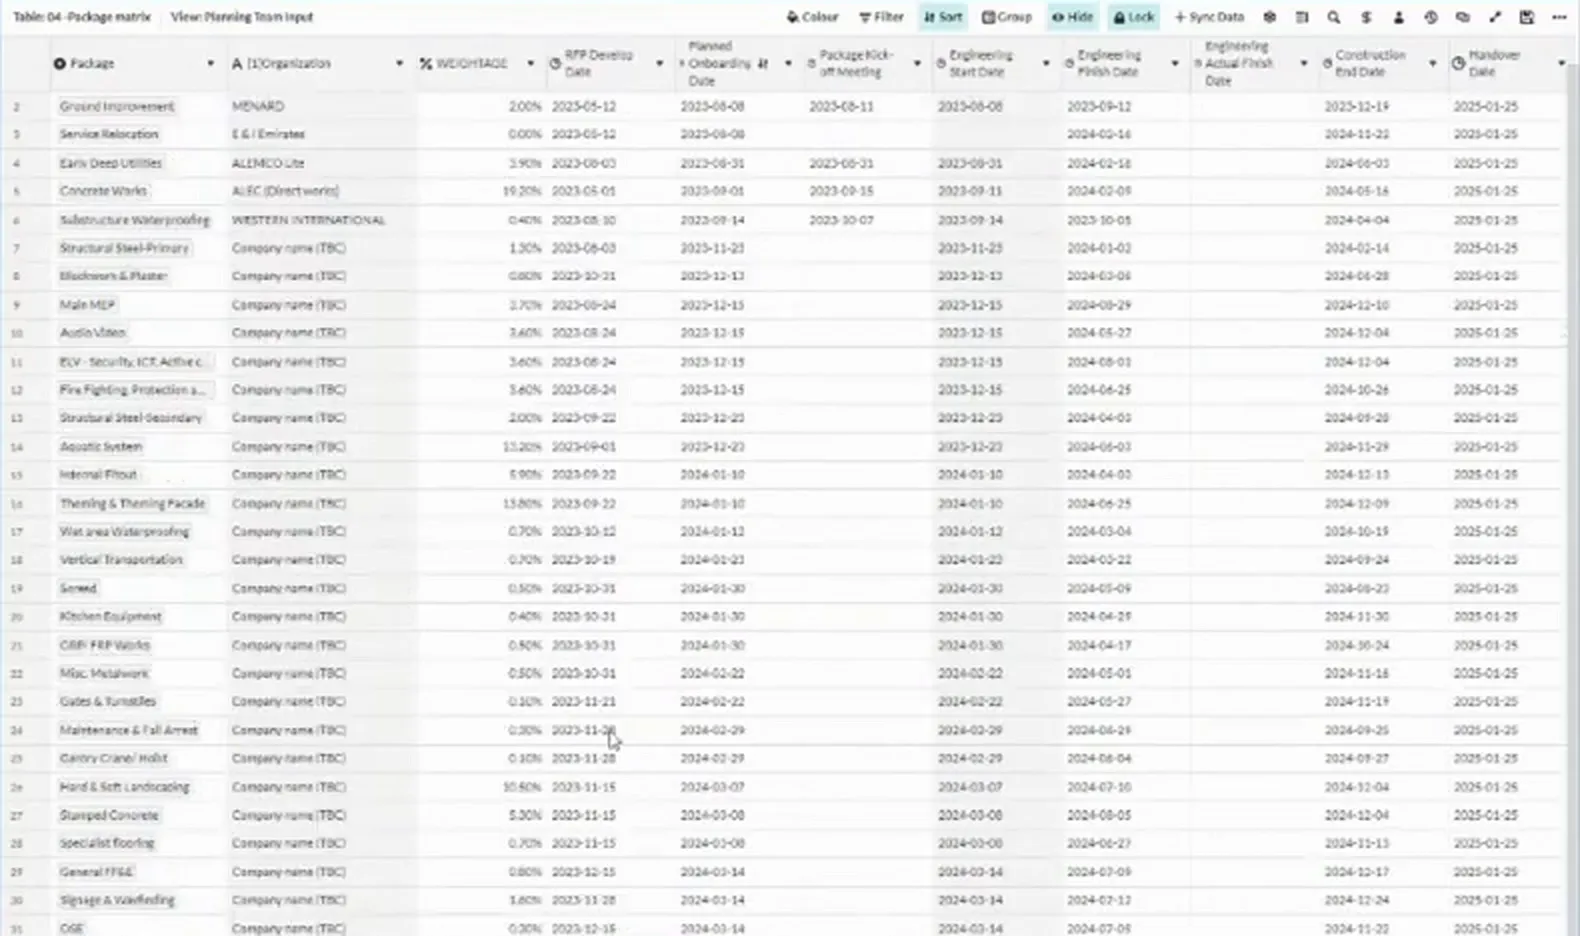
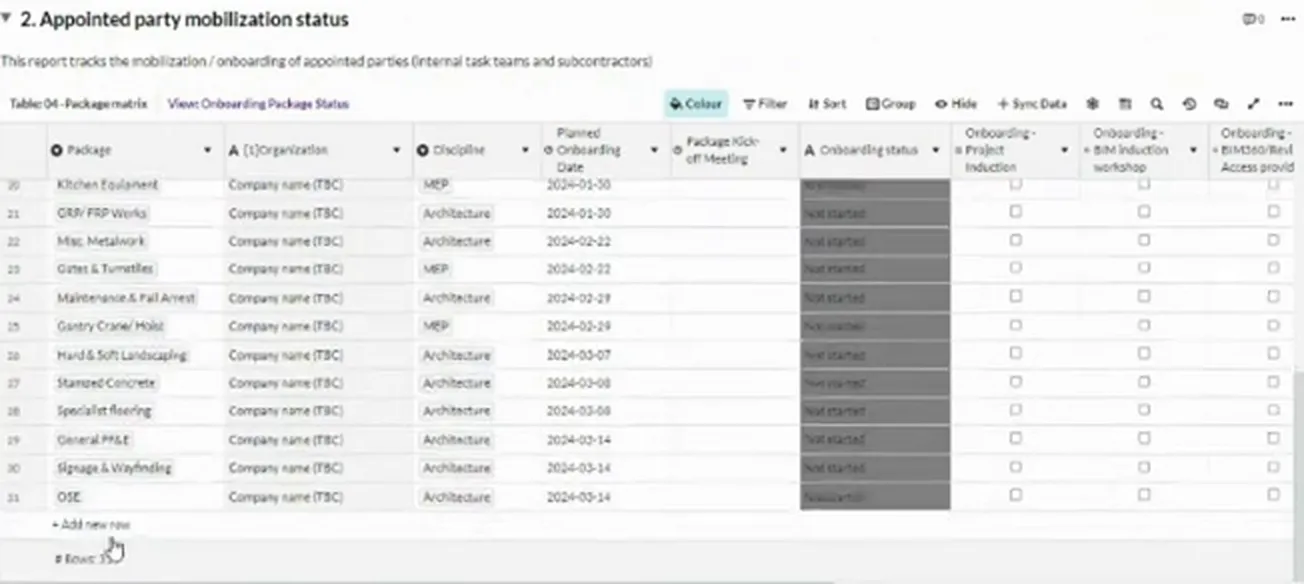
As each onboarding step was completed, Abdelrhman updated it in the matrix. The team could compare those recorded steps and the resulting mobilisation status with the planned onboarding date. A planned onboarding date sets the expected timing. Completed steps show how far the package has progressed through onboarding.
Read engineering progress against expected drawings
The expected drawing set gives issued and approved counts their context. ALEC's QA/QC approach registered shop drawings still to be produced as well as those already produced, with their metadata held in Aconex.
For onboarded packages, the matrix brought together total, issued and approved shop-drawing counts and calculated engineering-progress measures. The project team could inspect drawing delivery against the package's expected documents, including the distinction between drawings issued and drawings approved.
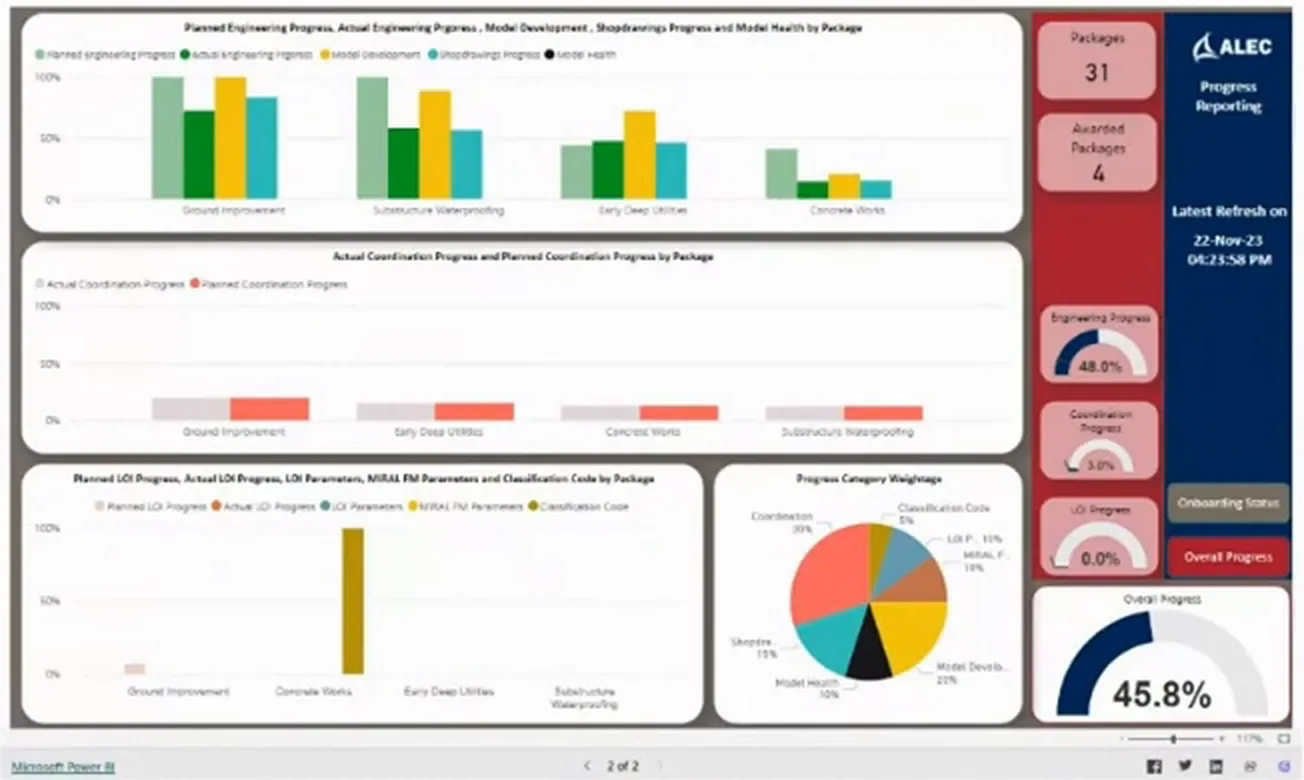
These measures concerned engineering drawing delivery. Construction progress appeared as a separate category in the wider report.
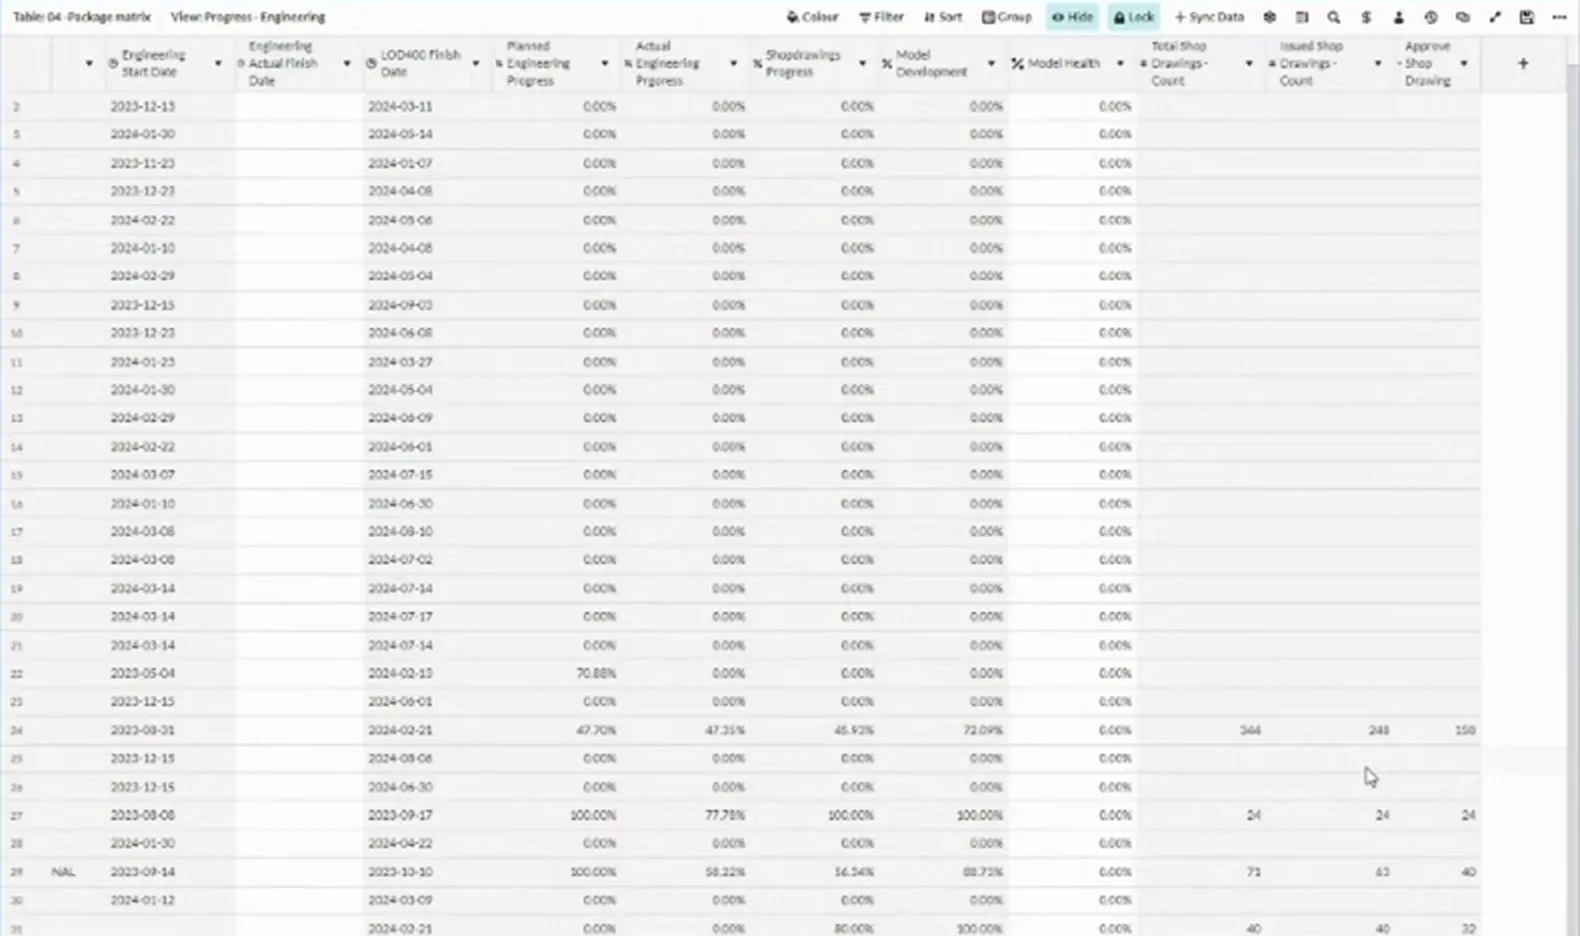
Abdelrhman described a daily Aconex refresh but noticed that the integration was marked inactive during the demonstration. The calculation and the supply of refreshed document data remained distinct parts of the setup.
Share progress without opening every working table
The people maintaining package information needed access to the working tables. Abdelrhman named planners, commercial colleagues and the digital delivery team among those who might require it. The reporting audience was wider.
The progress is meant to be shared with everyone.
Abdelrhman Negm
ALEC shared mobilisation status and appointed-party progress through Morta views. These let the team and upstream participants inspect the packages and compare onboarding with planned dates without opening every underlying table.
Data also went into Power BI, with the report embedded back into Morta. Its charts brought different aspects of package progress together for the reporting audience. Some contributions remained manual, including the onboarding updates, alongside the calculated measures.
Keep the growing setup understandable
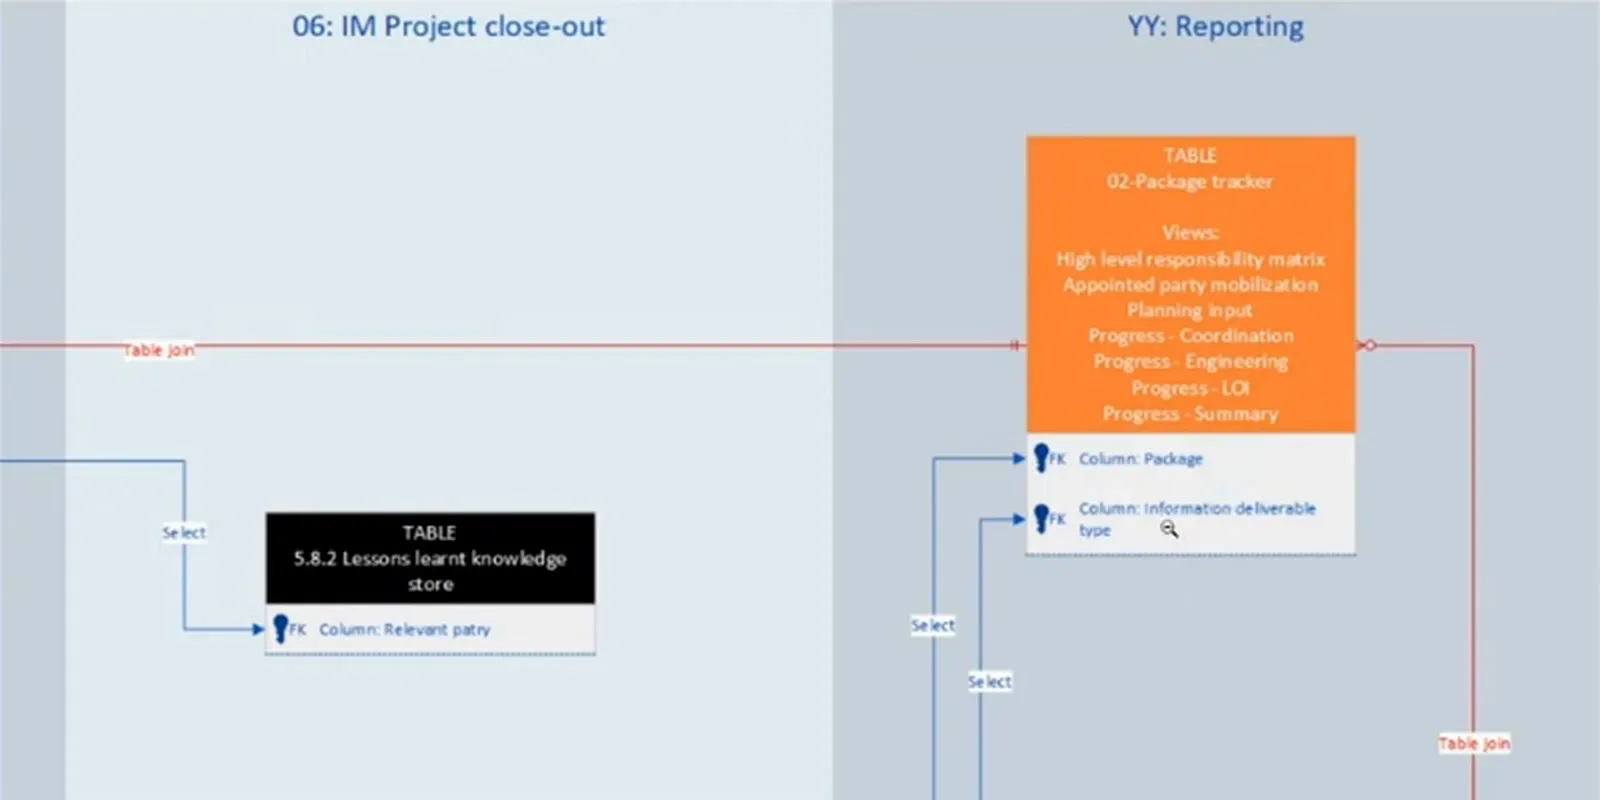
Abdelrhman and Andy Boutle sat down together to understand the table relationships they had built. Andy created the map, which helped them see how the background tables connected as they continued developing the setup. The map was part of that continuing work, with the connected resources still growing.
Try Morta on a real project
If your package status has to be assembled from separate project records, try Morta on a real project.

